
27 Feb
2014
27 Feb
'14
9:04 a.m.
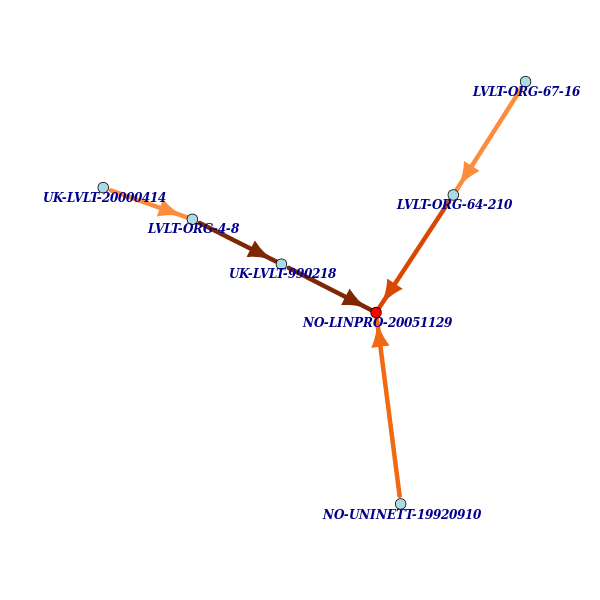
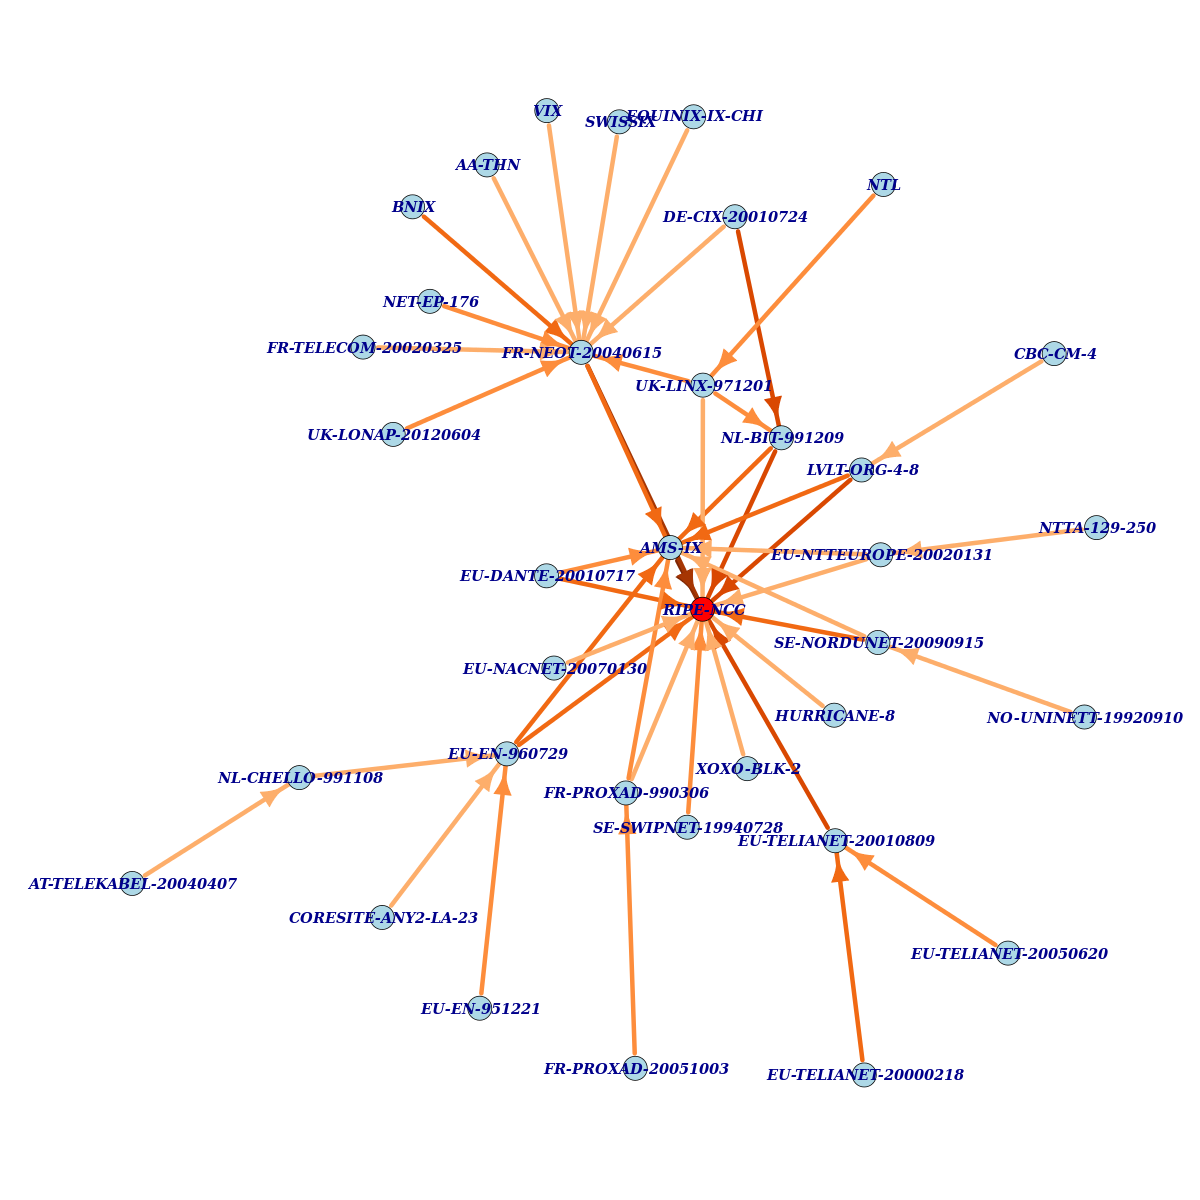
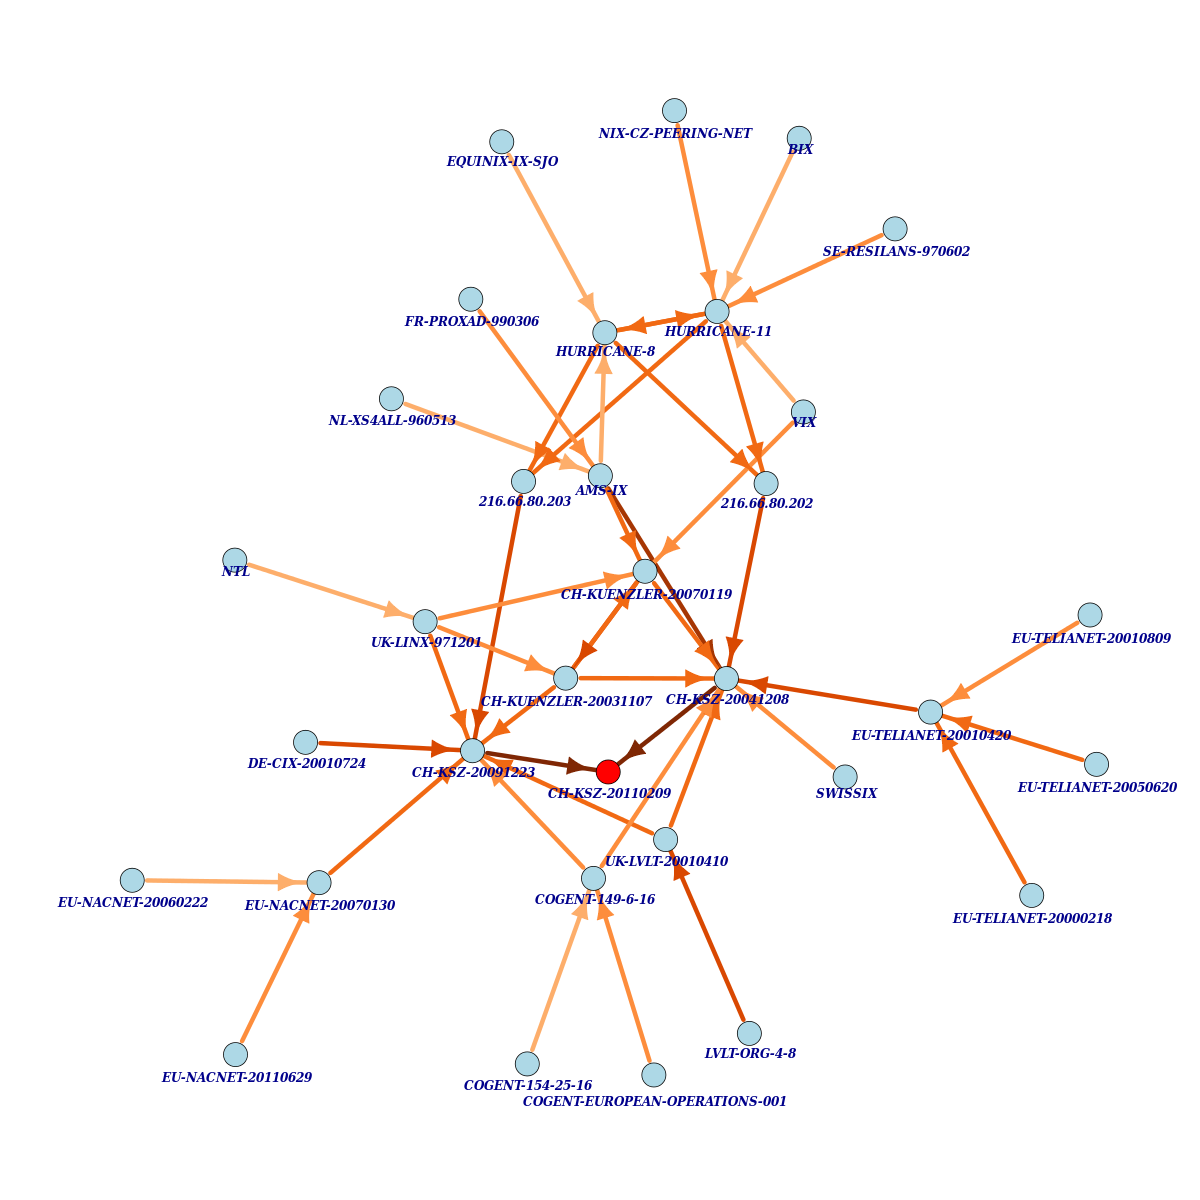
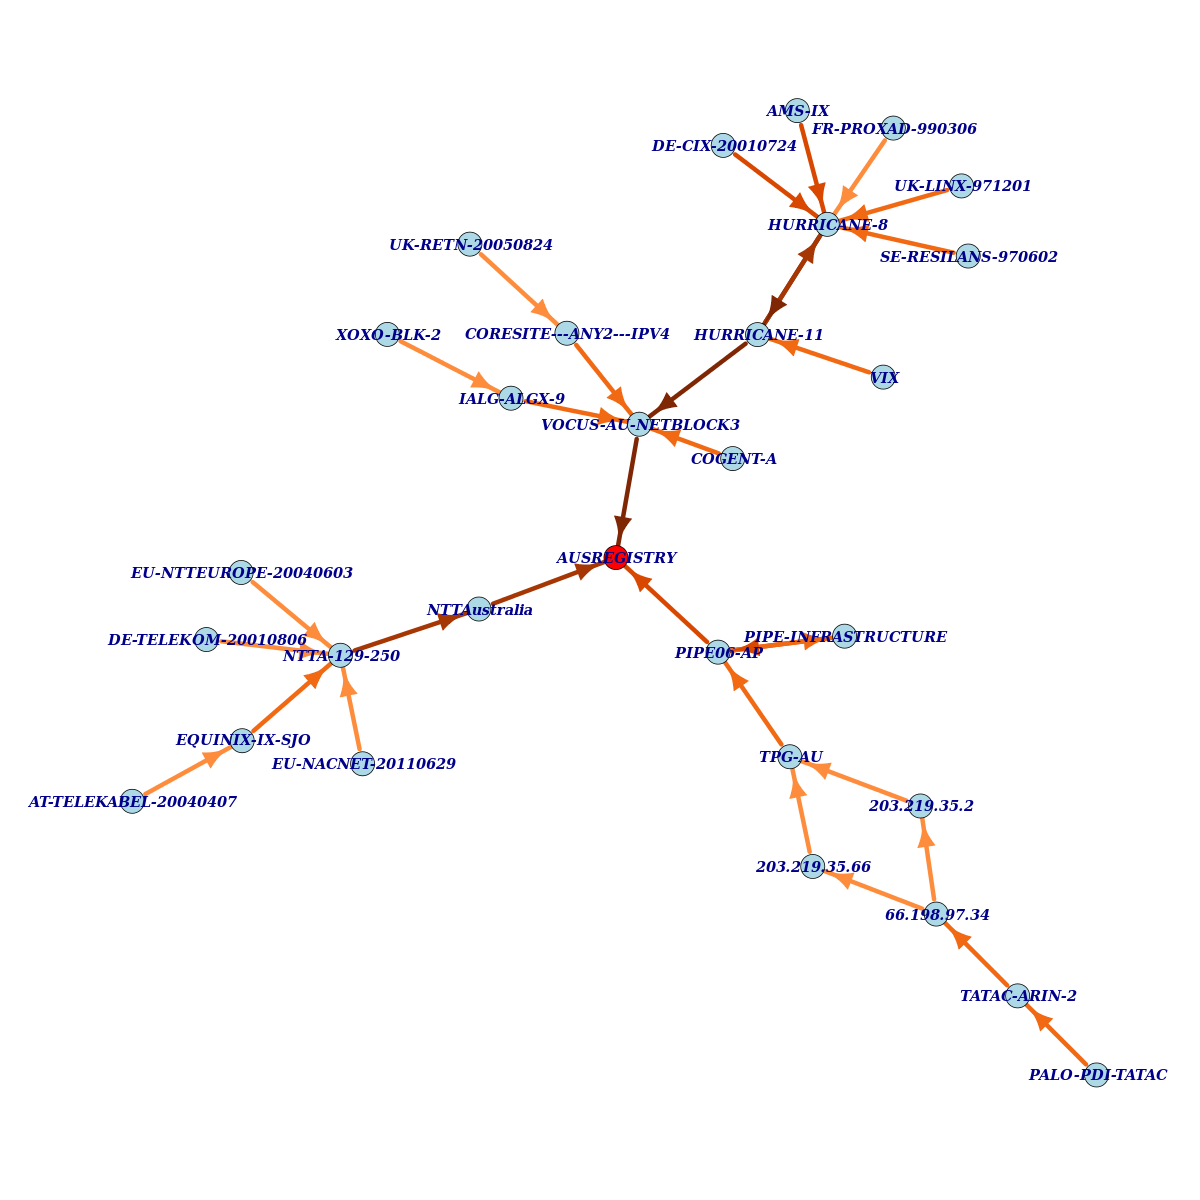
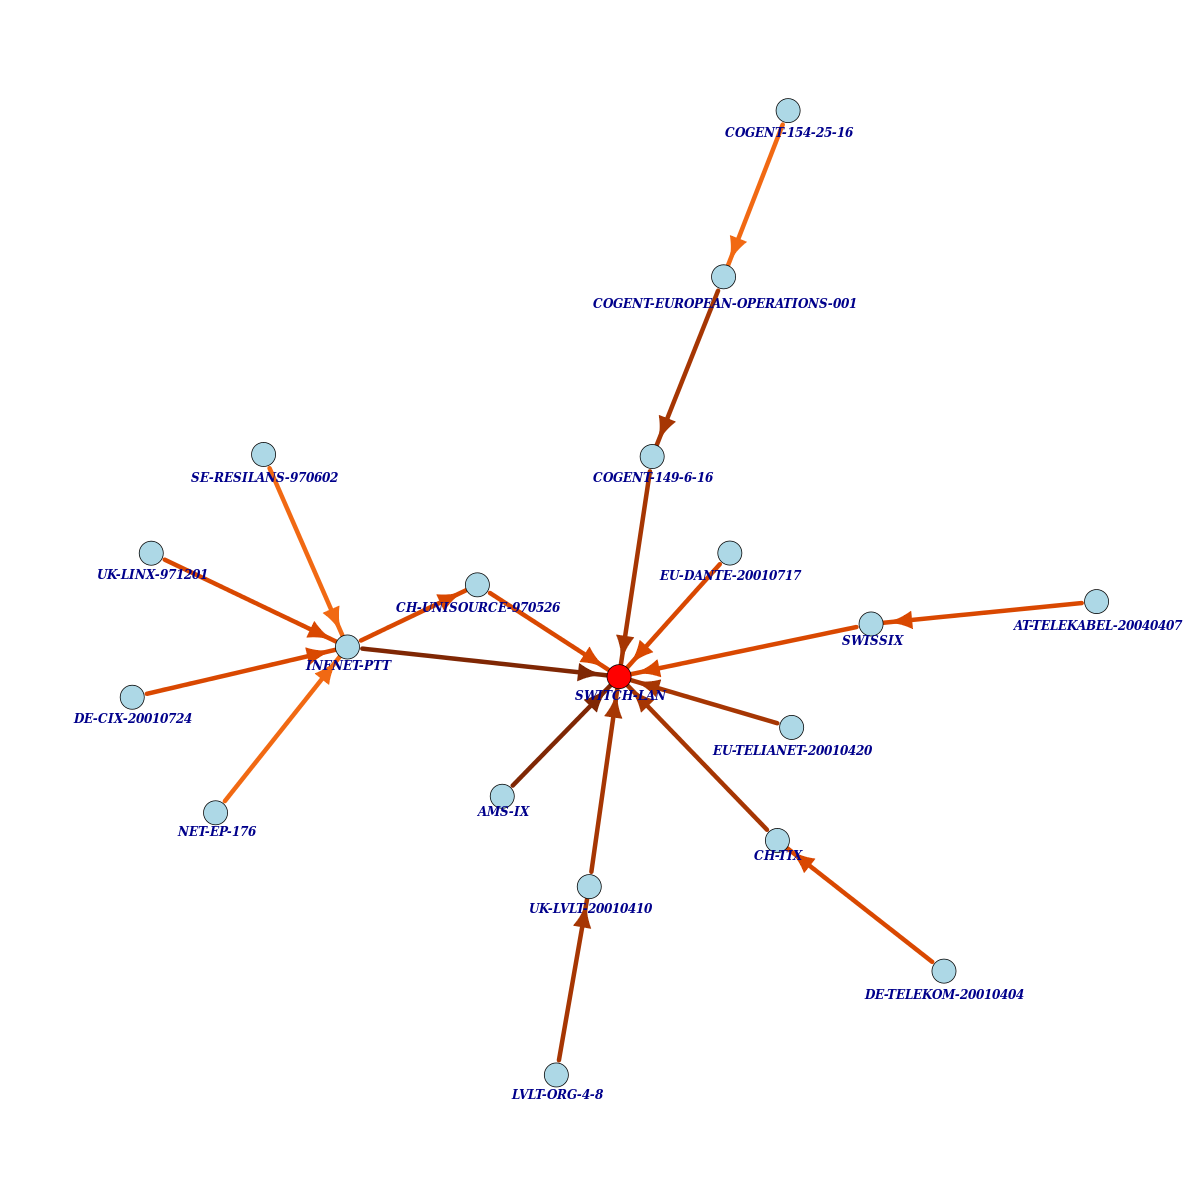
During some research I happened to visualise some random anchor calibration measurements and thought I'd share the graphs. The basis are IPv4 traceroutes from all (4500+) RIPE Atlas probes to the anchor encoded in the file name. The graphs show adjacencies that appear in more than 3% of all paths. IP addresses are aggregated by the network name as registered in the RIR registries. The darker an edge appears, tho more paths contain this adjacency; the colouring is scaled logarithmically. Enjoy Daniel