
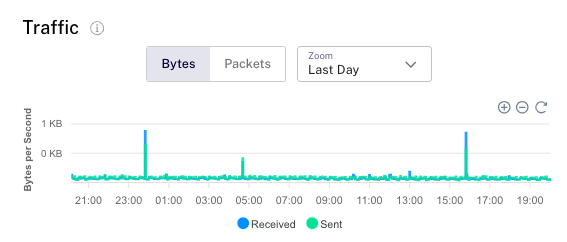
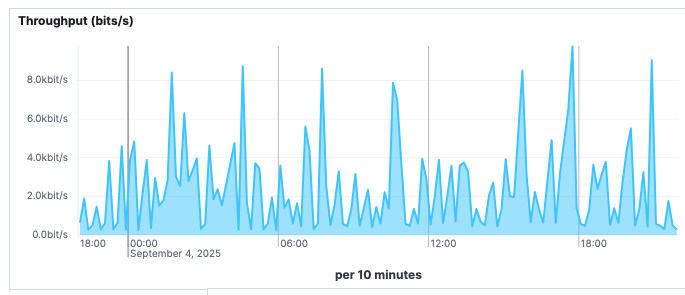
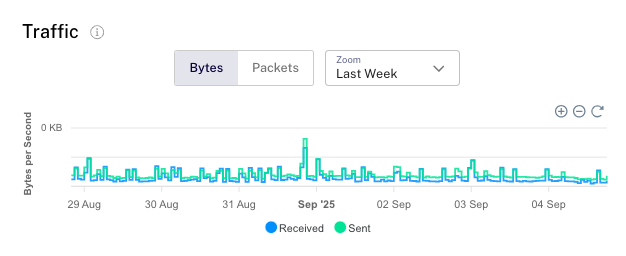
Dear All, Based on the conversation about traffic here some days ago I took a look into my statistics. I looked at the dashboard from RIPE Atlas and I looked at netflow from the router for my probe. Both from the last 24 hours. This is the dashboard and this comes from netflow it is summarised for IPv4 in and out and IPv6 in and out. Not to be confused netflow shows bits and the dashboard bytes. There is another difference, netflow has 10 minutes intervals and it seem the dashboard has 3 minutes. But independent of that, the graphs should have some similarities. I am not worried about that because the traffic is below any perception. But is there any explanation ? It becomes funny when I switch to "Last Week" All the traffic is below the 0 KB line. Maybe it should be 10 KB and the "1" is not visible for some reason. Kind regards Hans